BUILD · Research → story
A total needs a clock
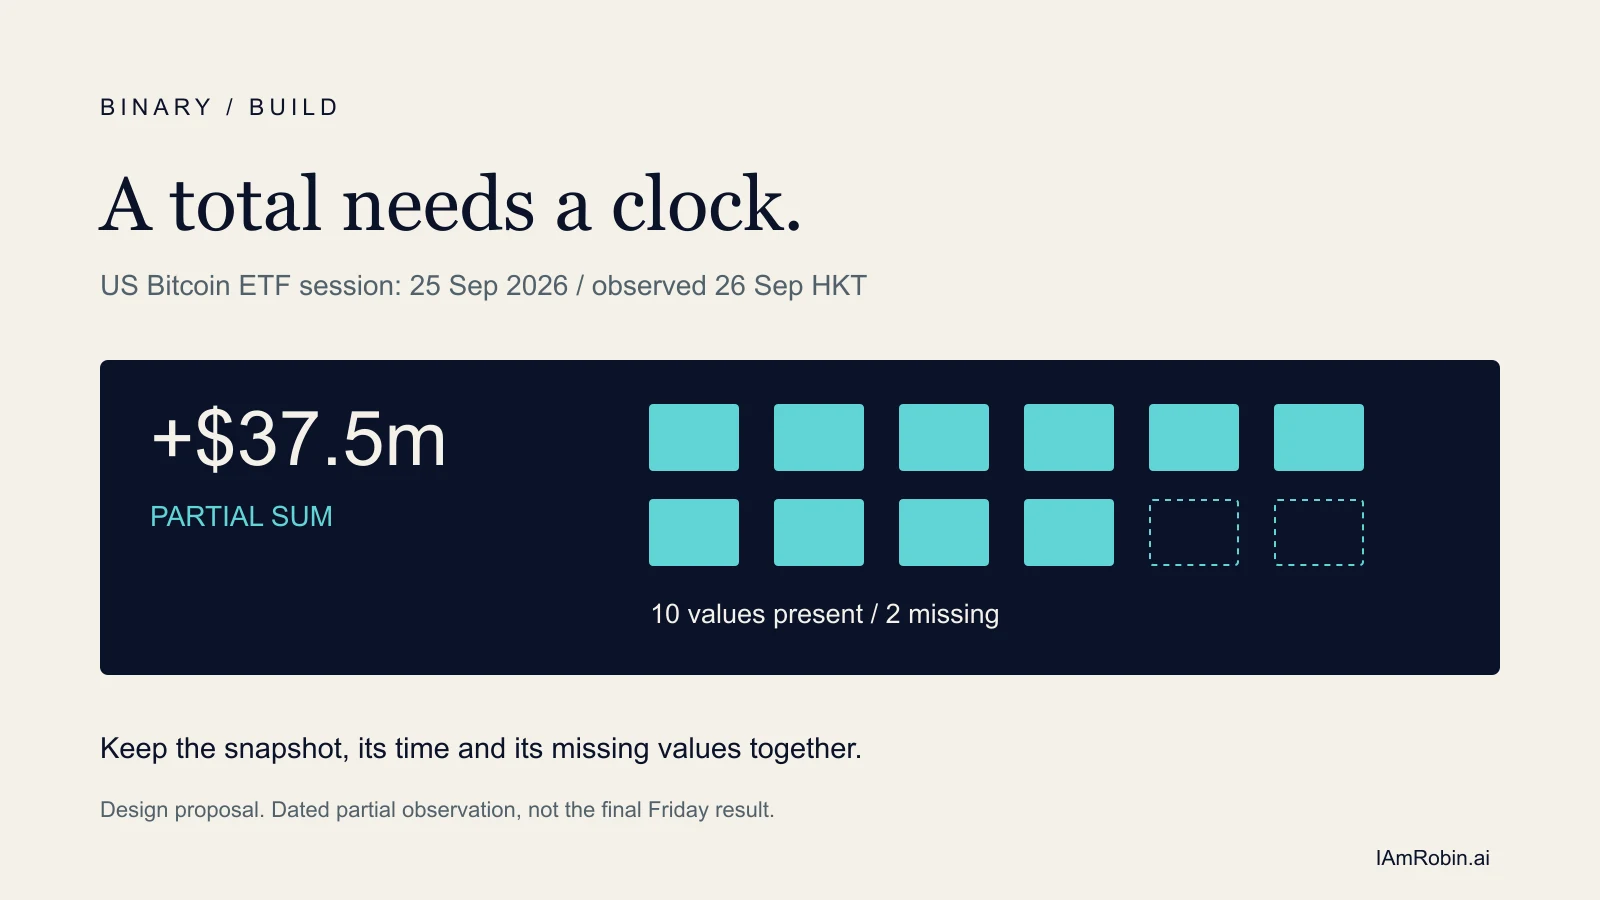
The arithmetic can be right while the headline is premature. A changing ETF row suggests a better way to build a dashboard.
A calculator can get every addition right and still help you write the wrong headline.
The September 26 Daily Special preserved two morning observations of the same US Bitcoin ETF session, September 25. The first showed a −$11.8 million total with seven of twelve fund cells populated. The later observation showed +$37.5 million with ten populated. Both sums matched the numbers then available. Neither row was complete.
The Farside table still showed the second state when reopened for this story on September 26 HKT. These are dated observations, not Friday’s final result. The provider’s precise update times were not established.
Give the number its luggage
Imagine you are building the small card somebody screenshots before a meeting. In the centre sits +$37.5m. It fits beautifully. Remove the surrounding row, though, and you also remove the two missing funds.
I would give that card a second line: 10 of 12 fund values present; 2 missing. Put the US session date beside the retrieval time and timezone. Let the reader open the exact snapshot behind the card. If the provider has not supplied an update time, leave that time unknown instead of borrowing the retrieval time for it.
This is a proposed interface, not a dashboard experiment with measured results. Its purpose is modest: keep the conditions attached when a number travels. A copied image should retain enough context for somebody outside the room to read it correctly.
A positive subtotal can still finish negative
For the later snapshot, call the two missing contributions R. Hold the displayed entries fixed. The completed total would be 37.5 + R, in millions of US dollars.
If R were −50, the result would be −12.5. If R were +10, it would be +47.5. Those are invented arithmetic examples, not estimates or bounds. Without a defensible limit on R, the sign remains unresolved. Revisions to already populated cells could change the calculation too.
Ten of twelve sounds reassuring. It measures the count of available cells, not the share of assets represented, the confidence in a forecast, or the accuracy of those cells. A progress bar labelled “83% certain” would invent information the table does not contain.
Let the label change before the headline
A builder can make this distinction visible with a small rule. While a constituent is missing, show a partial sum and name what is missing. Once all expected cells contain numbers, check their sum against the provider’s total at the displayed precision. Only then describe the row as numerically complete and reconciled. That label still does not mean every issuer report has been independently verified.
Keep each earlier snapshot. Otherwise the person investigating a changed headline sees only the final row and cannot reconstruct what the earlier reader knew.
The useful output is a number with its observation time, coverage and revision history still attached. Leave those details on the card, especially when the number looks ready for a headline.