03 · Daily Special · Signal 3
The ETF Total That Was Still Arriving
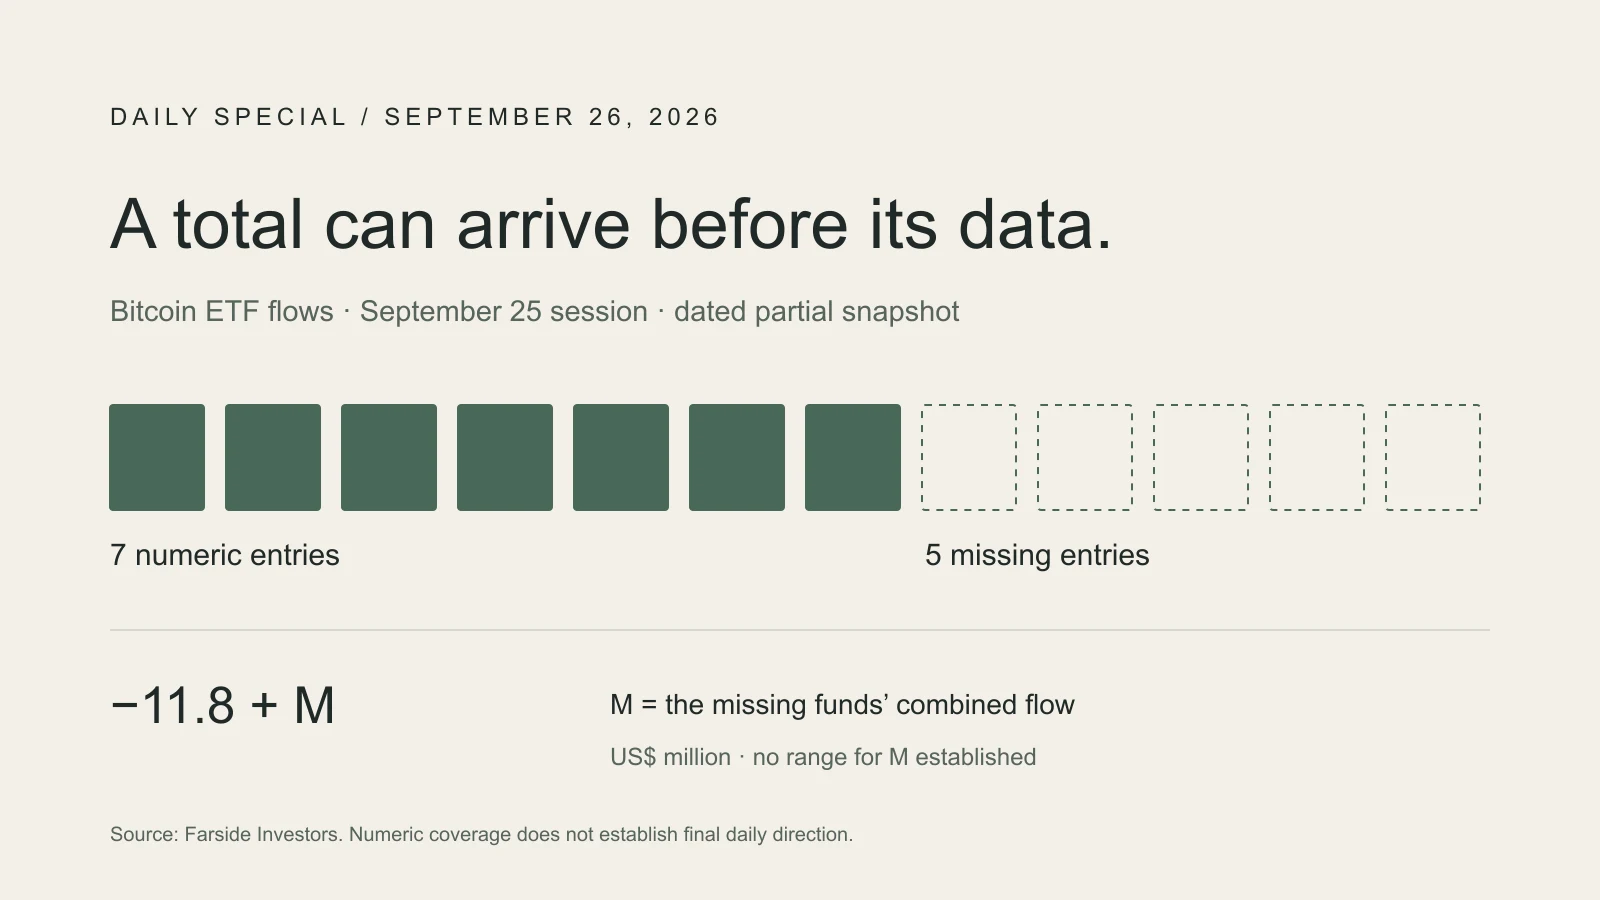
A dated Bitcoin ETF flow reconciliation and a map separating fund flows, share trading and network use.
A spreadsheet can add up perfectly and still leave you with the wrong headline.
On the morning of September 26 in Hong Kong, Farside’s Bitcoin ETF table showed a September 25 total of −$11.8 million. Five of its twelve fund cells contained dashes. The arithmetic had reached the end of the row; the reporting had not.
That is an interesting little gap. A reader sees “Total” and supplies “complete.” The page has not earned that extra word.
Give the missing funds a seat
Seven cells contained numbers: BITB at −11.8 million and six at zero. IBIT, FBTC, EZBC, BRRR and HODL were still missing. Adding the available numbers reproduced the displayed total exactly. This checks the addition, not the completeness of the evidence.
Call the missing funds’ combined flow M. If the published entries stay unchanged, the full total will be −11.8 + M, in millions of dollars. A hypothetical M of +20 would produce +8.2; an M of −20 would produce −31.8. These are examples, not forecasts. We have not established a range for the missing contribution, so the partial row cannot settle the day’s direction.
The downloadable sheet preserves all twelve cells and the calculation. It also reconciles the previous day’s fully numeric row at its displayed precision. That gives the comparison a proper starting point while leaving room for later corrections.
During a second source check while preparing this note, FBTC showed +$49.3 million, and BRRR and HODL showed zero. The displayed total had become +$37.5 million, with IBIT and EZBC still missing. The sign changed while the row was incomplete. That makes the lesson visible: neither snapshot settles the final direction. The sheet keeps both, and the illustration above preserves the first.
Three places where money can move
Imagine buying an existing ETF share from another investor. Your cash changes hands, and you acquire exposure. That transaction alone does not require the product to issue a new share.
FINRA explains the two layers: shares trade between investors in the secondary market; creation and redemption happen with the issuer in the primary market. Turnover and net fund flows therefore answer different questions. A busy trading day can involve the same shares changing hands repeatedly.
There is a further wrinkle. On July 29, 2025, the SEC permitted in-kind creations and redemptions for covered crypto exchange-traded products. An authorized participant can transfer the underlying asset through an in-kind process. A dollar-denominated flow figure consequently does not, by itself, prove a matching cash purchase on an exchange at that moment. The approval also does not tell us which process any particular fund used on this Friday.
Then there is the network itself. Bitcoin can move between addresses for reasons that a fund-flow table cannot explain. The trading screen, the product’s balance sheet and the blockchain each offer a view. Combining them requires a bridge made of evidence.
Count activity without inventing people
Even opening a blockchain dashboard does not finish that bridge. Coin Metrics’ adjusted transfer-value method filters specified artifacts, including self-churn and cold-wallet reshuffling. The adjustments help explain why a raw transfer total should not automatically become a claim about economic use. They do not turn every remaining transfer into a customer payment.
Its metrics FAQ makes another useful distinction: one user can control several addresses, and one custodian address can represent several users. Counting addresses is easier than counting people. It is also a different task.
For a future comparison, I would place complete ETF flows beside same-period adjusted transfer value and address activity, with the definitions visible. Agreement would give us something to investigate; disagreement would be interesting too. Even agreement would leave the broader claim about “Web3 health” needing evidence from the activities we actually mean. This note has not collected a current onchain series and cannot report that confirmation.
Let the total finish arriving
The practical improvement is small: record when the table was read, keep the missing cells, and distinguish the available-cell sum from a complete-session total. When the row fills, reconcile it again and retain the earlier version. A numeric zero deserves its own cell. A dash deserves patience.
This Special completes the research sheet. The flow watchpoint stays open, and no investment decision follows from completing the sheet. The next useful observation is a complete, reconciled row; the next broader question needs independent network evidence. Until then, I would let the remaining two funds arrive before giving Friday a plot.
Sources and working sheet
The five linked sources were reopened on September 26, 2026, Hong Kong time. The Farside observation is a snapshot of an automatically updated aggregation, not independent verification of each issuer’s report. FINRA and Coin Metrics supply explanatory methods; the SEC decision is historical context. The arithmetic examples and evidence map are authored analysis.
Download the dated row, sign test and reusable reconciliation sheet.