03 · Daily Special · Signal 3
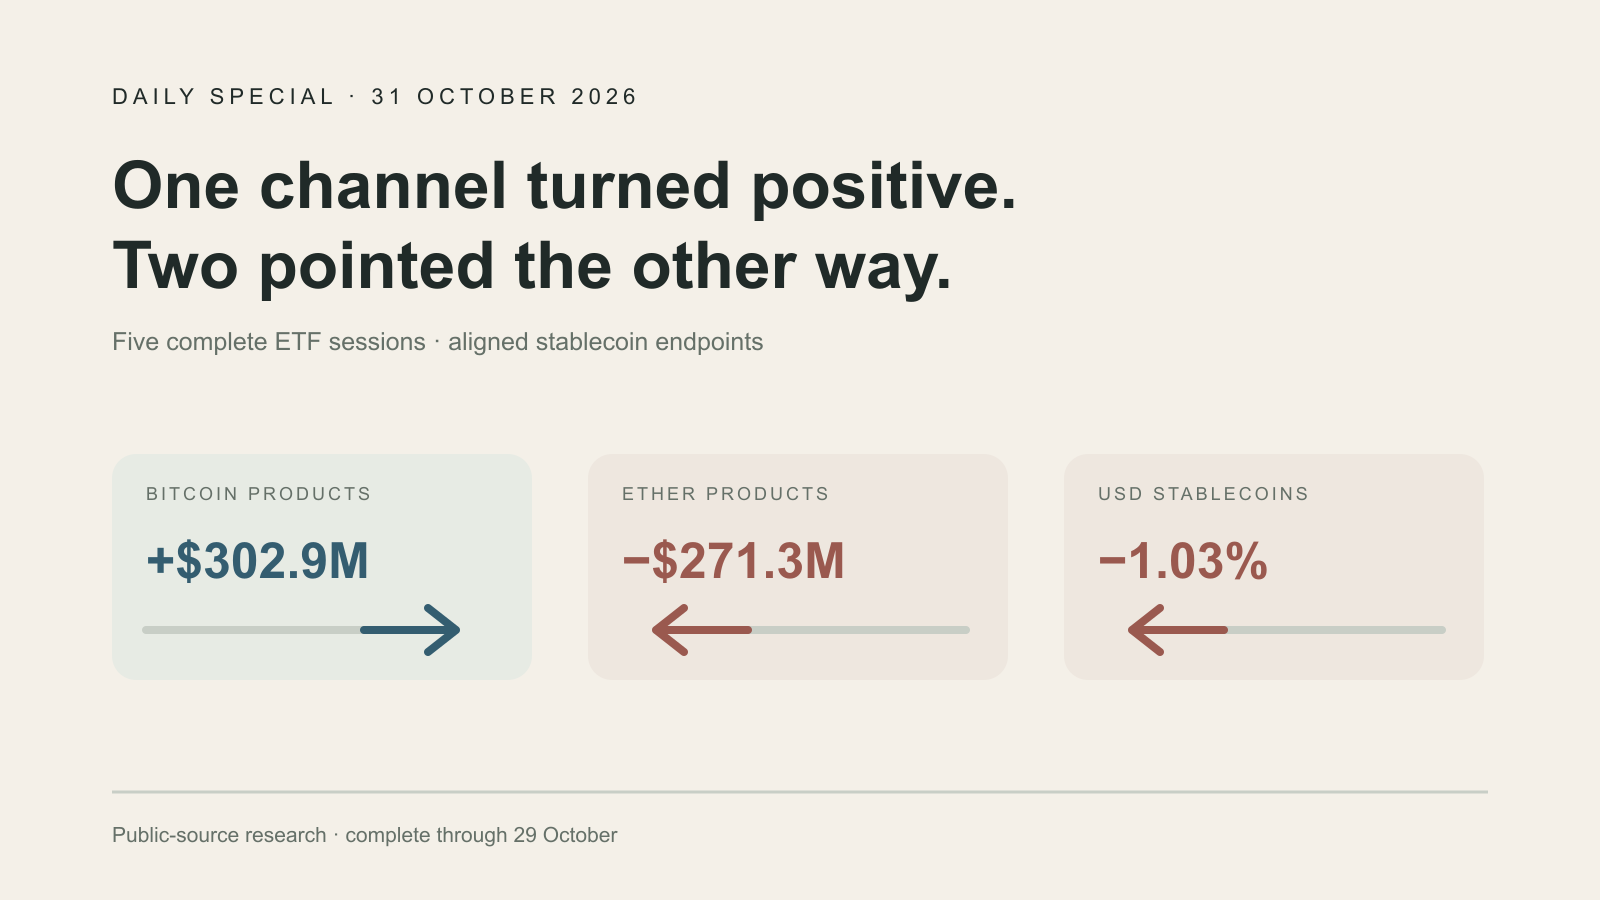
A dated public-source comparison across five complete U.S. spot-Bitcoin and spot-Ether ETP sessions and aligned USD-pegged stablecoin endpoints; no trade, transfer, allocation, portfolio change or underlying investment decision.
Bitcoin Inflows Tell One Part of Crypto’s Story
Money reaches the cryptocurrency market through several doors. Some investors buy Bitcoin or Ether through funds listed on U.S. stock exchanges. Others use dollar-linked tokens called stablecoins, which circulate on blockchain networks and can serve as a means of payment or a balance held between transactions. Together, these channels offer different views of activity in the same financial world.
The participants in this story perform distinct jobs. Bitcoin and Ether are the assets underlying two groups of investment products. Fund providers make those products available through brokerage accounts. Farside Investors publishes estimates of the money flowing into and out of them. DefiLlama, a separate data provider, tracks the estimated circulating value of stablecoins.
Looking across these measures helps frame a bigger question: how widely does an apparent expansion in crypto finance extend?
That question sits behind this follow-up to the October 22 Daily Special. By the morning of October 31, a further set of complete figures was available. The task was to see whether Bitcoin fund flows, Ether fund flows and dollar-pegged stablecoin circulation had expanded together over the latest shared window.
Finding the shared window
An exchange-traded fund, usually shortened to ETF, gives an investor exposure to an asset through a product traded on a stock exchange. A spot Bitcoin or Ether product holds exposure to the underlying cryptocurrency. Farside’s flow estimates describe the net creations and redemptions of these listed products: positive figures indicate net inflows, while negative figures indicate net outflows.
Stablecoins provide a different view. These tokens are designed to track a reference currency, in this case the U.S. dollar. DefiLlama estimates the dollar value of the supply circulating across the assets it tracks.
Imagine two pipes fitted with daily water meters and a separate reservoir with a gauge showing its level. The Bitcoin and Ether ETF figures resemble the meters: they record a flow during a period. Stablecoin circulation resembles the reservoir gauge: it records an amount at a particular time. Agreement across all three would suggest that expansion reached several parts of the system. Following the movement of individual dollars would require a different kind of evidence.
Before comparing the readings, the dates needed to line up.
At the research cutoff of October 31, 2026, at 09:20 Hong Kong time, Farside’s October 30 rows were still being filled in. Several Bitcoin and Ether products displayed dashes, representing missing or unfinished entries. The Bitcoin subtotal also changed during the live update.
October 30 therefore remained outside the comparison. The latest five trading sessions with a number in every displayed fund column across both tables were October 23, 26, 27, 28 and 29.
That left a clear window for the ETF figures and matching October 23 and October 29 endpoints for stablecoin circulation. The endpoint comparison spans six calendar days.
Two fund groups take different paths
The window opened on Friday, October 23, with Bitcoin products recording estimated net outflows of $137.9 million. Ether products moved in the opposite direction, attracting a small $4.4 million net inflow.
The relationship reversed after the weekend.
On Monday, October 26, Bitcoin products received $110.3 million, while Ether products recorded $88.6 million in outflows. Tuesday brought a further $176 million into Bitcoin products and $60.2 million out of Ether products. On Wednesday, the respective figures were $137.3 million in and $21.4 million out.
Thursday, October 29, completed the window. Bitcoin inflows slowed to $17.2 million. Ether outflows reached $105.5 million, their largest daily withdrawal in these five sessions.
Adding the daily estimates gives the central result:
| Measure | October 23–29 result |
|---|---|
| Bitcoin ETF net flows over five sessions | +$302.9 million |
| Ether ETF net flows over five sessions | −$271.3 million |
| USD-pegged stablecoin circulation between endpoints | −$3.125 billion, or about 1.03% |
The daily sequence matters. Bitcoin’s positive total followed an opening outflow and four consecutive inflows. Ether’s negative total followed a small opening inflow and four consecutive outflows. Each group changed direction after the first session, then maintained that direction through October 29.
Combining the two ETF totals produces a positive $31.6 million. That figure is arithmetically correct, and it compresses a substantial difference into a small positive balance. Bitcoin’s net inflows were largely offset by Ether’s net outflows.
For a question about the breadth of expansion, the separate totals carry more meaning. They show strength concentrated in one of the two product groups.
The stablecoin reading
The third measure moved downward as well.
DefiLlama’s historical series put the estimated circulating value of USD-pegged stablecoins at $303,248,946,001 on October 23 and $300,124,090,437 on October 29. The decline was $3,124,855,564, or approximately 1.0305%.
This reading adds context because stablecoin circulation measures a different part of crypto finance. A growing supply can be consistent with greater use of dollar-linked tokens. A shrinking supply shows that the estimated circulating dollar value has contracted across the tracked assets.
Its meaning remains tied to that definition. Establishing how much cash reached trading venues, or how holders intended to use their tokens, would require further evidence. Likewise, adding the stablecoin decline to the ETF flow totals would mix a change in circulating value with flows into two specific groups of investment products.
The useful comparison here is direction. Over the aligned window, Bitcoin ETF flows were positive, Ether ETF flows were negative, and the stablecoin measure contracted.
What the completed figures settle
The question entering this update was whether completed data would reveal expansion across all three measures. The answer supplied by this window is divergence: one expanded while two contracted.
That preserves the earlier HOLD status attached to the research question. Here, HOLD means that broader confirmation remains pending. It describes the state of the evidence; investment decisions belong to a separate process.
The update also provides a small but useful piece of closure. The completed rows through October 29 support a dated comparison, replacing the uncertainty associated with their earlier partial view. Bitcoin attracted net inflows across those five sessions, while the companion measures pointed elsewhere.
The figures remain estimates. Farside says its tables are generated automatically in real time and carries a disclaimer about possible errors or inaccuracies. DefiLlama’s tracked coverage and historical classifications can change. This article uses the preserved historical stablecoin readings for the aligned dates, keeping the comparison anchored to the research cutoff.
Five ETF sessions and two stablecoin endpoints establish a short observation. The durability of the pattern, the motives of the investors and its relationship to future prices remain open questions.
For now, the completed picture gives Bitcoin’s inflows their proper setting. They are a clear positive reading in one channel of crypto finance, alongside Ether fund withdrawals and a smaller pool of circulating dollar-pegged tokens. The next question is whether those directions begin to converge.
Sources:
- Farside Investors — Bitcoin ETF flows, read October 31, 2026.
- Farside Investors — Ether ETF flows, read October 31, 2026.
- DefiLlama — historical stablecoin series, October 23 and 29 readings preserved in the October 31 research archive.
- October 22 Daily Special, the earlier public comparison.