03 · Daily Special · Signal 3
The outflow slowed. It did not reverse.
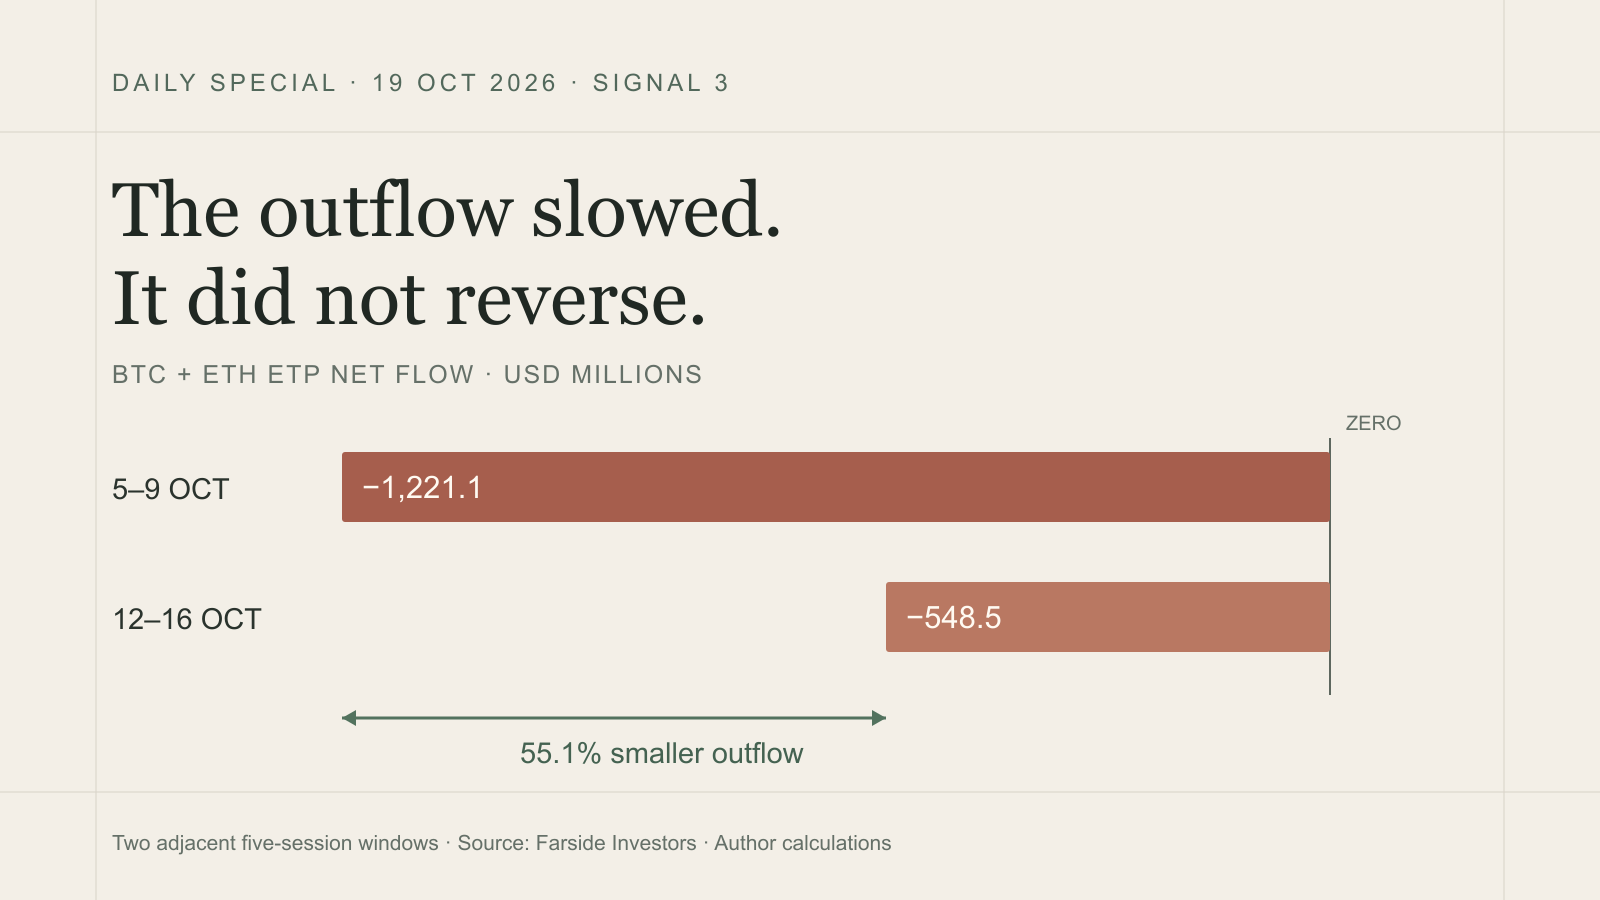
A dated comparison of two adjacent five-session U.S. spot-Bitcoin and spot-Ether ETP flow windows, separating slower outflow from positive-flow reversal; no trade or portfolio action.
A bathtub draining at half speed is still draining.
That obvious little sentence becomes strangely slippery on a market screen. Last week looks less red than the week before. The line rises. The loss shrinks. Relief arrives early and quietly changes the verb from slowing to reversing.
So I reopened the Bitcoin and Ether fund-flow tables and gave the two verbs separate clocks.
The latest five completed U.S. sessions, October 12 through 16, show $228.4 million of net Bitcoin ETP outflow and $320.1 million of net Ether ETP outflow. Together, that is $548.5 million leaving the displayed products.
The previous five sessions were much worse: $678.9 million from Bitcoin products and $542.2 million from Ether products, or $1.2211 billion combined.
The drain slowed by 55.1%. The water level still fell.
One number needs two clocks
The first clock measures direction: is the five-session sum above or below zero?
The second measures velocity: is the outflow getting larger or smaller?
In the latest comparison, velocity improved sharply. Bitcoin’s outflow magnitude fell 66.4%. Ether’s fell 41.0%. The combined difference was $672.6 million.
Direction did not improve enough to cross zero. Both sums remained negative.
This matters because the action under review had a simple condition: call the flow picture broader only when both Bitcoin and Ether five-session sums turn positive together. The condition is deliberately boring. It prevents one cheerful day, or one enormous fund, from repainting an entire week.
October 13 supplied exactly that temptation. Bitcoin products took in $175.7 million and Ether products took in $24.8 million. It was the only session in the ten-day sample when both groups were positive. Three of the next four combined daily totals were negative. Tuesday was green; the rolling window was not.
The doorway was narrow
Totals can look broad even when most of the movement passes through one or two doors.
Across October 12-16, IBIT contributed -$165.4 million and FBTC -$60.2 million. The other ten Bitcoin funds displayed by Farside summed to just -$2.8 million. Those two funds accounted for almost the entire -$228.4 million Bitcoin result.
Ether was narrower still. ETHA contributed -$299.0 million of the group’s -$320.1 million total. The other ten displayed products together contributed -$21.1 million.
This does not make the totals unreal. It changes the question. Instead of saying “crypto money left,” we can say that the displayed primary-market flow was negative and highly concentrated in a few products.
We still do not know why each creation or redemption occurred. A row cannot tell us whether one institution changed exposure, an authorized participant adjusted inventory, or investors moved between products. The table contains arithmetic, not motives.
What crossed the pipe?
The SEC permits authorized participants to create and redeem crypto ETP shares in kind. That mechanism links the listed product to deliveries of the underlying asset or cash through a specialized primary market.
It does not turn the flow table into a census of people buying or selling. Fund shares also trade between investors on exchange. Nor does a redemption measure how many people used Bitcoin or Ethereum, how much software activity occurred on either network, or what price will do tomorrow.
Think of it as one pipe in a much larger building. We measured the direction and speed of water through that pipe. We did not inspect every tap.
That narrower description is still useful. Two adjacent windows tell us that the pressure eased. The issuer rows tell us where the movement concentrated. The sign tells us the predeclared confirmation has not arrived.
Keep the improvement, keep the minus sign
There is no prize for calling a reversal first. There is value in noticing that the second derivative changed before the first one did, as long as we do not let calculus cosplay as certainty.
My conclusion is therefore two sentences, not one. The outflow slowed materially. Both latest five-session sums remained negative.
I would keep watching until the same completed window is positive for both asset groups, then place it beside price, basis, liquidity and a clearly defined network-use measure. Agreement would be worth investigating. Disagreement might be more interesting. Neither result would create a trade by itself.
The full research artifact contains all ten daily totals, the issuer decomposition, formulas and limits. Farside warns that its tables update automatically and may contain errors. I did not independently rebuild every issuer record or establish a causal driver.
Today’s work completes the comparison. It does not change a portfolio, place an order or predict Monday’s number. For now, the honest label is simple: the drain is slower, and the bath is not filling yet.